ICC model
This page contains downloads and information associated with the paper: Corrias A & Buist ML. Quantitative cellular description of gastric slow wave activity. Am J Physiol Gastrointest Liver Physiol, 294(4):G989–G995, Apr 2008.
This article presents a quantitative model of the cellular processes that lead to the generation of slow wave activity in the stomach. We provide the following implementations of the model:
- A CellML implementation available as a zip or tar.gz archive. The archive contains the CellML model in control conditions as well as two additional CellML files: one where there is no IP3 release and one with increased IP3 release.
- A C++ implementation as a zip or tar.gz archive. The archives also contain a CodeBlocks project file for easy compilation of the code.
- A Matlab implementation available as a zip or tar.gz archive. These archives contain an init.m and a compute.m file generated by COR;
These files can be used to reproduce the results published in the paper. The following figures were generated using the CellMLSimulator software to generate the graphical outputs. These models reproduce the numerical experiments presented in Figure 5 of the Corrias & Buist (2008) article.
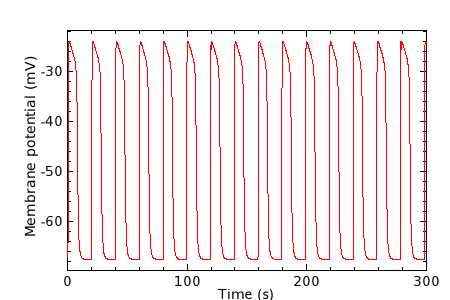
The control ICC model from Figure 5(A) of the Corrias & Buist (2008) article. (CellML code)
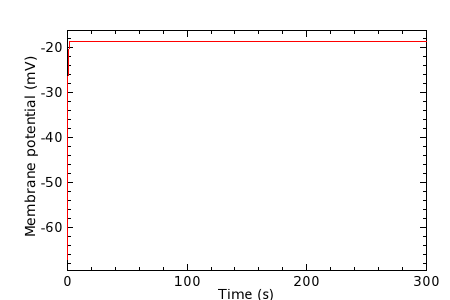
The no IP3 release simulation from Figure 5(B) of the Corrias & Buist (2008) article. (CellML code)
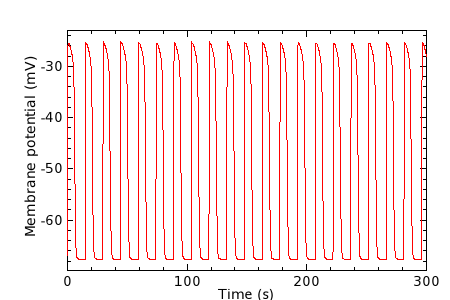
The high IP3 concentration simulation from Figure 5(C) of the Corrias & Buist (2008) article. (CellML code)